Just-in-time time management

You’re feeling overwhelmed, you’re not getting the results you want and time is spiralling away into a vortex of the past with the event horizon of complete chaos snapping at your arse. You don’t have time for a time management course, you need a just-in-time time management miracle. This is what you need to do…
It’s really simple but deceptive – diagnose the problem and put a solution in place. The stressful thing is that if you understood the problem and had a solution you would have implemented it already. The problem with problems is that they don’t have obvious solutions. The real problem is understanding the real reason for the problem or going back to what engineers call the root cause.
The universe is complex and made up of layers of systems all stacked on top of each other and it’s the same with problems – problems can be complex and layer on top of each other in such a way that the root cause can seem to be hidden.
How to diagnose the root cause of your time management problem
Get an objective view of the problem. If you’ve walked through a forest before you’ll know how difficult it is to see beyond a few trees and get a big picture or a ‘helicopter view’. The best way to do this is to ask someone else to help you with some ‘outside’ perspective. The more knowledgeable that person is the more informed and helpful that opinion will be. Most problems manifest as symptoms that are consequences of other things. One problem can have consequences that create other problems in the way dominoes knock each other over. So digging into the root cause requires some systems thinking and a deeper and more protracted analysis. One technique to achieve this is to ask the “5 Whys” where each ‘why’ digs deeper into the cause-and-effect chain to reveal potentially hidden causes. You can always do this by yourself if you have the time and patience but it’s the difference in perspective that someone else offers that can help to uncover your blind spots.
Just in time learning
When you’re struggling to find time to get things done the last thing you have time for is a training or coaching course on time management. So you need a different approach. The best way to solve this problem is to use a management technique called just-in-time. It’s a management-by-exception approach addressing problems as they occur in real-time.
Use the Pareto principle
Fortunately, you will most likely find that most of your problems (approximately 80 per cent) are caused by a small number of core or vital issues (approximately 20 per cent). This is the power of the Pareto principle, also known as the 80-20 principle. The phenomenon that many things in the world seem to work like this was first observed and documented by an Italian polymath named Vilfredo Pareto, who identified this as a statistical power law distribution while looking at income distribution and land ownership. Later, the management consultant Joseph Juran expanded the concept in the context of quality control and improvement techniques. What better way to make a significant improvement than to identify the vital few things that are the cause of all your problems?
In my opinion, the reason this works in the time management space is that time management techniques build on top of each other like bricks in a wall. If one brick is missing the other doesn’t work well. Acquire your missing brick and put it in the right place and you can then complete the wall and get your time management house in order.
It’s a bit like finding the missing catalyst that can get your reaction going. You want to see achievement fireworks but it’s not going to happen unless you have the right mix of chemical ingredients. If one chemical is missing the reaction is not going to take place. Using this chemistry analogy I have developed a periodic table that classifies and categorises the various time management and productivity elements. If you’re not into chemistry then think of it as different types of building blocks or bricks.

Identify the root cause of your time management problem and implement just-in-time learning to solve it.
You need structure to be able to identify what’s missing
Imagine if you had a map of all the productivity elements in it and it was structured logically, which enabled you to find any missing pieces. This would empower you to find your problem area and apply a just-in-time learning intervention. Imagine if it had structure and logic and was easy to navigate – a bit like a periodic table of chemical elements. Well, you’re in luck, I’ve developed one for you.
I call it the Technology Independent Period Table of Productivity Systems or TIPTOPS.
Structure is elegance
One of the most significant insights I have had from studying science, chemistry, astronomy and cosmology is that the universe has structure in every place you look. It is profoundly beautiful and elegant. Structure enables understanding and empowers logic and utility. So I wanted to borrow a framework from the world of science to help structure my understanding of productivity concepts and best practice. The matrix structure of the periodic table of chemical elements and the periodic table of quantum particles and forces in quantum physics were elegant examples.
Technology independence is the first key to time management skills development and mastery
TIPTOPS starts off as a technology-agnostic or independent approach to productivity and time management skills development and mastery. There are so many time management and productivity tools and apps that it’s tempting to think that you need to start by picking one and learning to use it before you can start improving your time management and productivity techniques. This myth is a dangerous misconception. The bewildering array of choices makes it difficult to decide where to start. Examples are ASANA, Monday, BaseCamp, ClickUP, Jira, Wrike, Trello, and the list goes on and on. Chances are your organisation is already committed to one or another platform and you have to make the best of it.
Here’s the secret – most of these are project management support tools that encompass many different productivity skills and techniques. What you really need to do is get back to basics, understand the principles and work on the core skills. You need to learn to walk before you can run. Using the chemistry analogy you want to start with the test tube stuff before your build a commercial-scale reactor.
So let’s look at the structure of the TIPTOPS table.
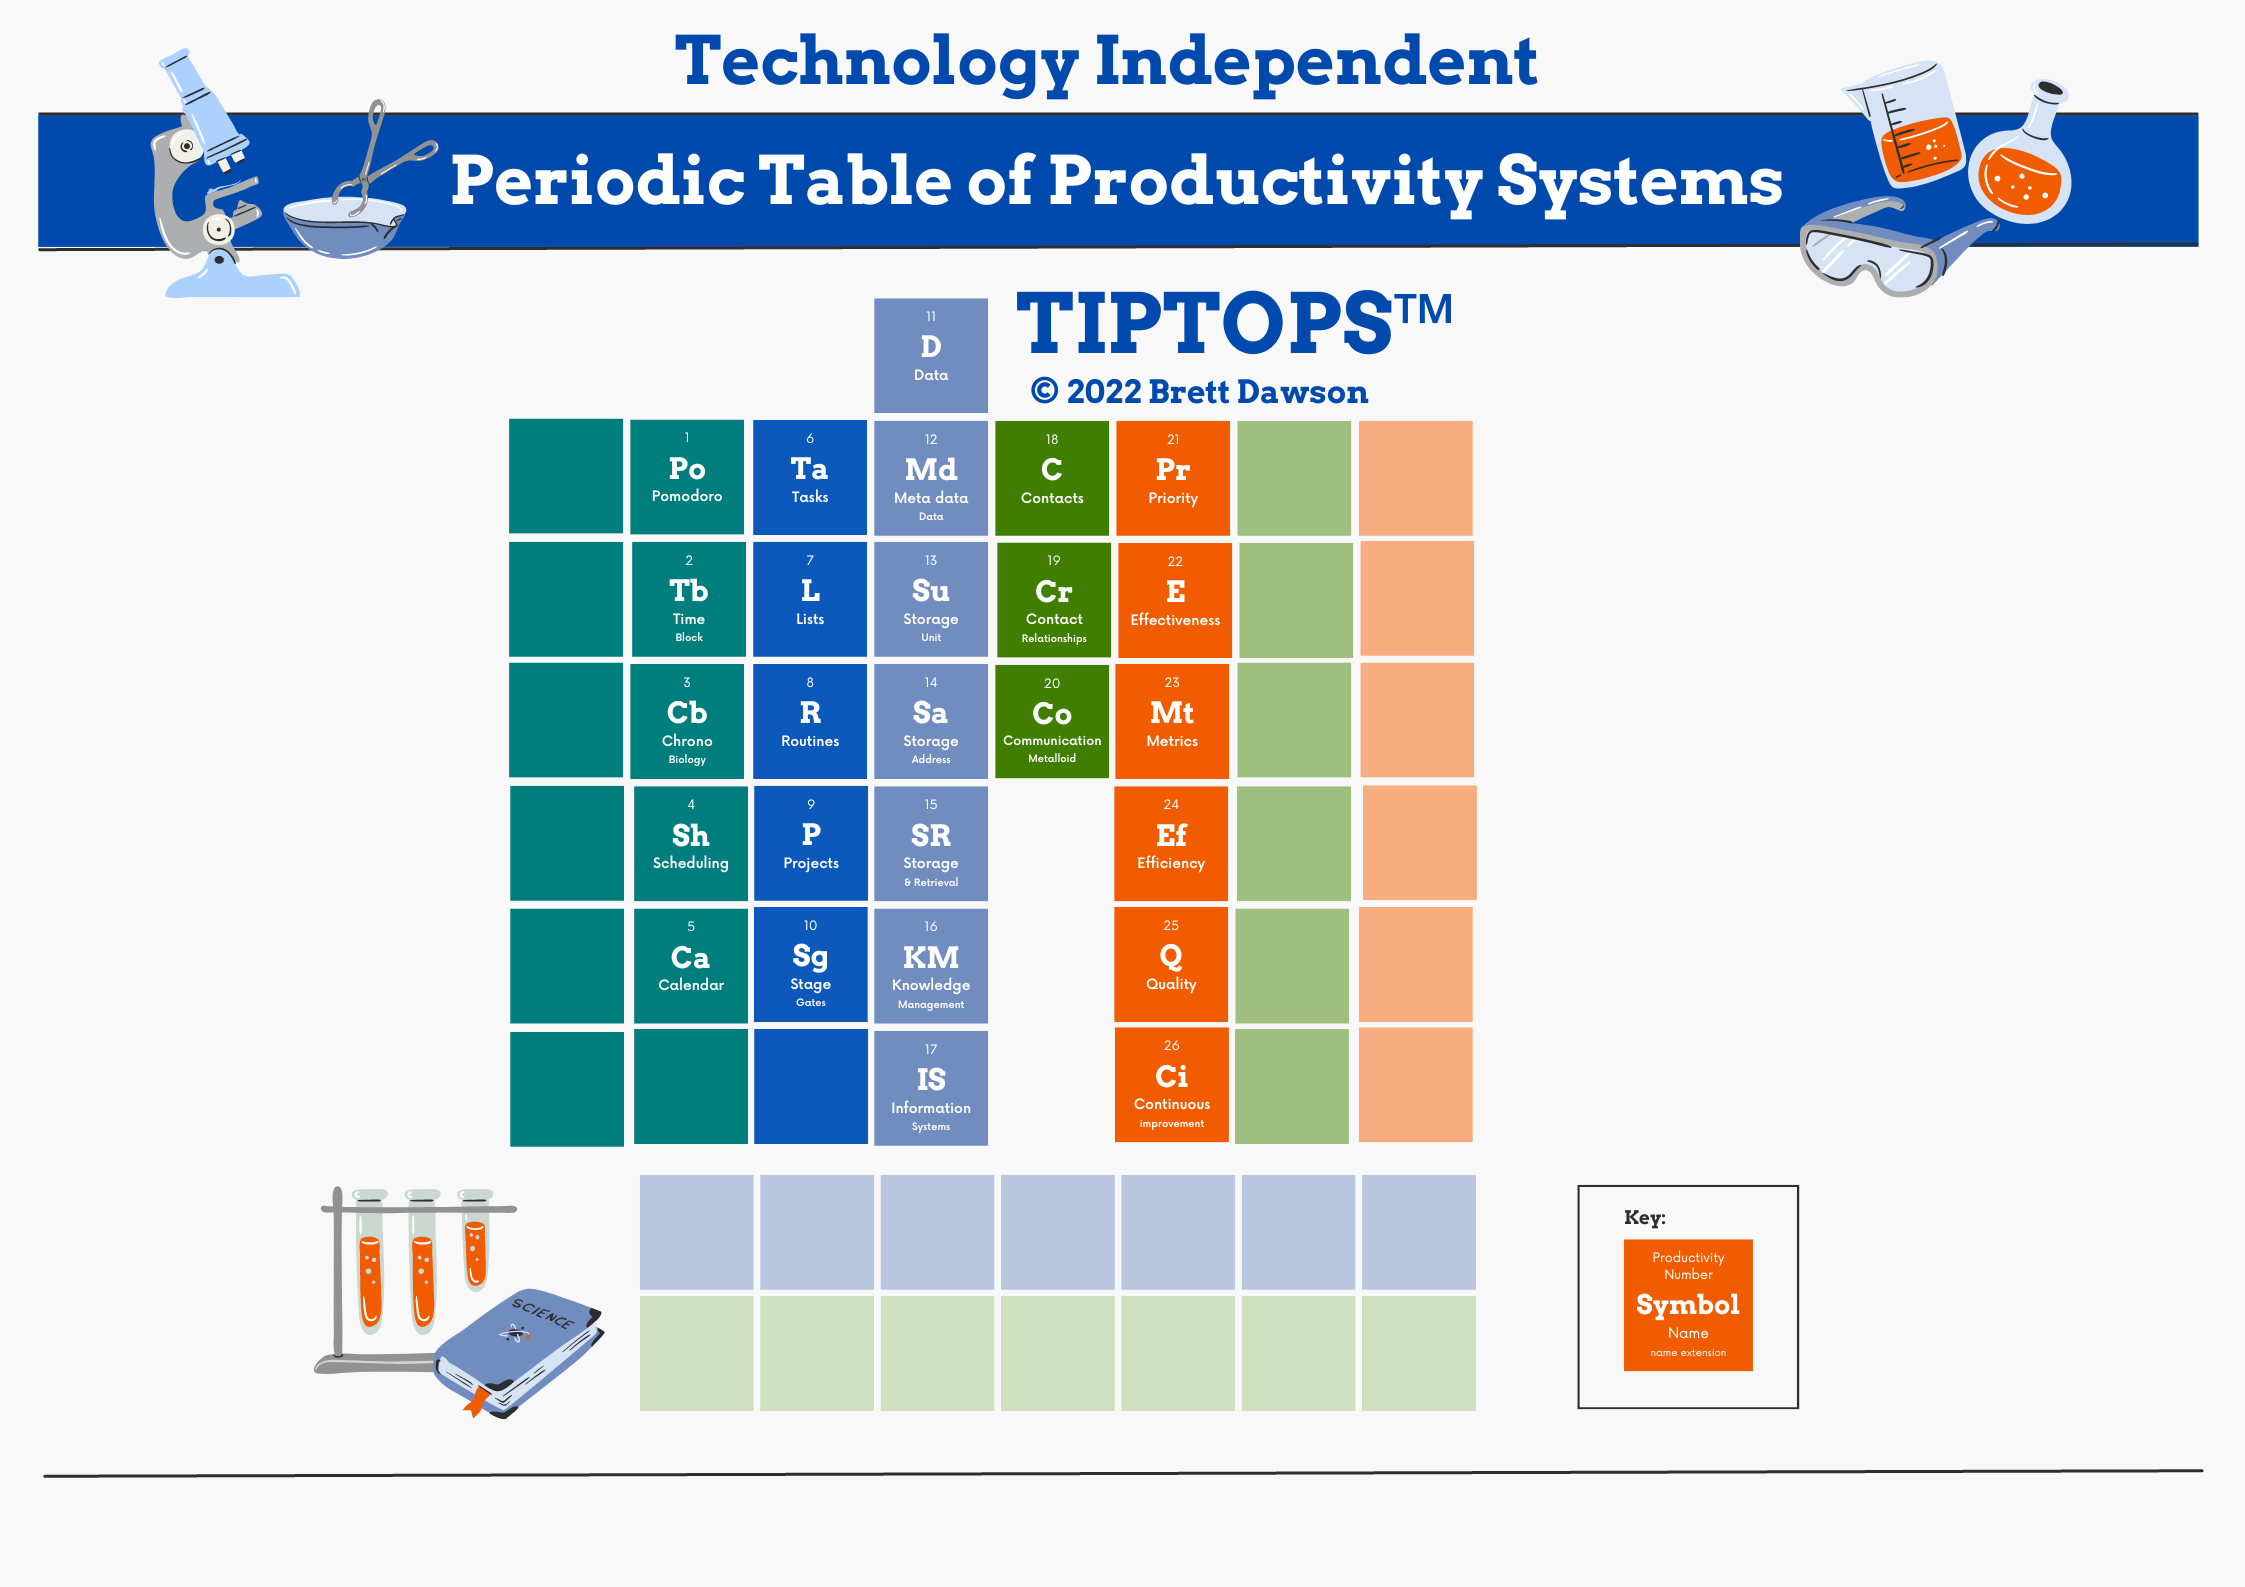
Structure of the TIPTOPS Table
The columns across the top of the table are divided into seven functional categories. How to manage time, tasks, data, people, production, productivity, and physical stuff. Within each column, the rows start with the most elementary and simple concepts and grow in complexity as you move down the table. This is similar to the way bigger and heavier elements are found lower down on the periodic table of elements.
Let’s look at each category column.
Group 1: Time management category
Group one comprises the productivity elements Po, Tb, Cb, Sh and Ca.
The first productivity element in the time category column is Po, which represents Pomodoro. Pomodoro is a time management technique that segments time into two separate intervals with one dedicated to focused work and the other dedicated to taking a break from doing work. The idea is that taking short breaks between focussed work intervals and limiting the duration of each individual work interval enables you to be more productive with your time by recognising that fatigue needs to be managed.
Next is Tb representing time blocks. A time block is a scheduling technique used to dedicate a period of time to a specific activity. A time block is a non-negotiable dedication to a specific period of time. A time block is the most powerful way to focus on your most important work and prevent procrastination.
Next is Cb, representing Chronobiology. Everyone has a daily rhythm based on their own unique biology and sleeping patterns that influence when they are alert or feeling tired and rundown. Some people function better at night and are ‘night owls’, whereas others will perform at their best in the morning. You should have an intuitive feel for what time of the day is best for you to do different things. This is how you figure out and use your personal chronobiology to schedule activities.
Sh represents scheduling, which is the essential technique required to get something done. If a task doesn’t get scheduled it doesn’t get done. Selecting when you are going to do something, especially when there are a thousand other things to do, will determine what actually gets done. Productivity is about results.
Ca is for a Calendar, that represents the time available to get things done. This is presented in a graphic format and is divided up into discrete units of time, years, months, days and hours, depending on the level of granularity of the specific type of calendar.
Group 2: Managing Tasks
Group two comprises the productivity elements Ta, L, R, P and Sg.
Ta stands for tasks. This is the basic building block of a unit of work. Tasks should be broken down into the simplest form. Ideally, they should be single action items.
L is for Lists. Lists are a collection of tasks. Lists can be ordered or unordered depending on whether the sequence of tasks is relevant or important. When the sequence is relevant you can think of the list as a workflow or a process. Lists are ways to capture a full scope of work for a particular objective.
R represents routines. A routine is the same list of tasks or activities that is repeated in regular time intervals or following a trigger event.
P stands for Projects. Any objective that is more complex than a single task and needs to be broken down into a sequence of simpler steps or tasks is a project. A project has a finite scope of work represented by a collection of lists. A project most often requires ordered lists where there is task dependency (i.e. where one task can only be performed when another is completed and the sequence is important). Projects may comprise lists with multiple levels of complexity or dimensions e.g. the work breakdown structure of a project may be represented as a 2-by-2 matrix of lists of deliverables. A project differs from a routine in that the scope of work is finite and the project is completed once all the lists of tasks have been completed.
Sg represents stage gates, which is a task management technique in which a task progresses through a sequence of lists that represent a workflow. There are rules and criteria acting as conditional gates that determine whether any task can move from one list to the next. An example of this would be a project that is progressing through a feasibility assessment where greater levels of detail and cost investment are required to determine whether the project progresses to the next level of development.
Group 3 Managing Data
Group three comprises the productivity elements D, Md, SR, KM and IS.
D represents data, the most elementary form of information. The level of detail and complexity of any unit of data lies at the discretion of the person using that data. Data may be a number on a sheet of paper representing a statistic or an image comprising thousands of pixels.
Md represents metadata, which is the information about the data that helps to describe the data. Data has no meaning without a layer of metadata to put the data into context.
Su stands for storage units, which are the places you store data and information. Examples may be a table, a document, a folder etc.
Sa represents the storage address and is the way you describe where the storage unit is kept. It is an additional metadata layer describing the location with the requirement that the location needs to be uniquely defined. Examples may be a physical place like a piece of paper in a filing cabinet, a book in a library, an electronic image in a database or a page on a website.
SR stands for the storage and retrieval methodology. This is the methodology you use to store your data and find it when you need it. Data is useless unless you know where to find it and how to access it. This includes the permissions and security associated with the accessibility and use of relevant data and information.
KM stands for knowledge management. This is how data and information is structured, processed, developed, maintained and retained. Data and knowledge fit into a hierarchy of meaning as represented by the DIKW pyramid, which is an acronym for data, information, wisdom and knowledge. As more meaning is attributed to data it becomes information. In a similar way, adding more meaning to information develops knowledge and adding more meaning to knowledge enables wisdom. In the TIPTOPS table, KM encapsulates the structuring of both data and information and doesn’t attempt to discern at what level of organisation information becomes knowledge.
IS represents information systems, which combine all of the data management elements together. There are many different types of information storage and retrieval systems that can be used in different ways to develop and access knowledge.
Group 4 Managing People
C stands for contacts. This is a list of all the people you know in your contact network. Just as you know some contacts better than others, there are different types of contacts but ultimately it is a long list of contacts with relevant contact details. Examples are an address book, an email list, etc.
Cr represents CRM, which is traditionally about “Customer Relationship Management” but I’d like you to think of contact relationship management. This is the metadata associated with your contact list that helps you to differentiate between the different types of contacts you have and what the history of your interactions has been with them. Within the context of organisations, the organisational structure represents the nature of the relationships between different people in different roles and is a metadata layer of information associated with contact relationship management. Organisational design is a subset of CRM.
Co stands for communication. Communication comes in many different forms but ultimately this is about the manner in which you interact with others and share data, information, knowledge and wisdom with them. All the different types of communication fall under this element e.g. verbal, non-verbal, body language, written etc.
Group 5 Managing Performance
Group five comprises the productivity elements Pr, E, Mt, Ef, Q and Ci.
Pr represents priority. This is the ability to discern what the more important things are in relation to other options and to rank the order of importance.
E stands for effectiveness. The best way to get your desired results is to work on the right things. Your ability to be selective about what you spend your time on is what drives effectiveness. To be effective you need to prioritise the most appropriate activities.
Mt is for metrics. You can only really manage things that you can measure and monitor and this is best achieved with metrics. Some metrics are quantitative whereas others may be qualitative.
Ef is for efficiency. Efficiency is a time-based measure of productivity. It is the rate or speed with which something is achieved. Think of it as a performance metric divided by a time unit.
Q stands for quality. The efficiency of performance doesn’t mean anything unless the required quality is achieved. Quality is defined by standards, which are often associated with statistics and benchmarking.
Ci represents continuous improvement. In any productivity system, there is room for improvement and this is supported by a growth mindset of continuous learning. Continuous improvements can be realised in step changes or incrementally through a process of mastery over time.
Conclusions
TIPTOPS is a time management and productivity classification system that can be used as a diagnostic tool to identify time management root cause problems and provide just-in-time training and coaching.
TIPTOPS is a proprietary framework that classifies all generic productivity skills in a two-by-two matrix of discrete productivity elements representing the layout of a periodic table.
TIPTOPS is a technology-independent approach to productivity skills, techniques and systems. This means that it doesn’t matter what productivity tool or app you are using, all of them will use a combination of the TIPTOPS productivity elements as principles and methodologies.
TIPTOPS divides productivity into five groups namely, time, tasks, data, people and performance.
Most time management methodologies and productivity systems comprise combinations of various TIPTOPS productivity elements. By identifying which of the TIPTOPS elements are missing from your skill set of best practices you can identify the gaps that need to be addressed on a just-in-time basis.
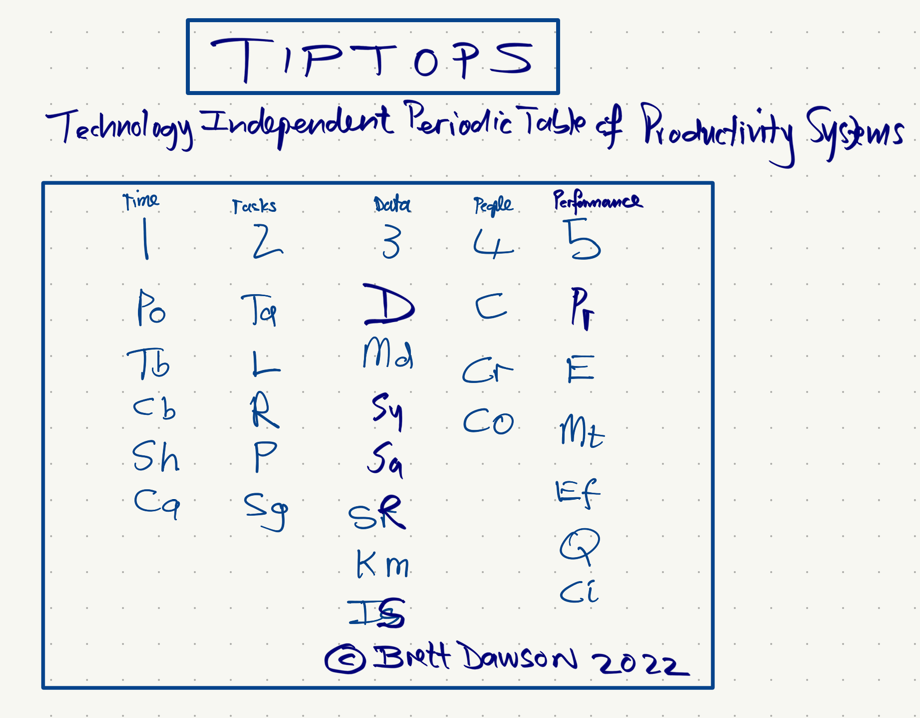
Caption: This periodic table concept started out as a hand-drawn image
Next steps – work with me
If you would like to use the TIPTOPS framework you have the following options:
1. Book time with me for a 1-on-1 strategy consultation using my calendar booking system.
2. Buy a batch license for your organisation for group training (schedule a discovery call to discuss this with me)
3. Get certified to use the TIPTOPS framework in your consulting practice and enter a licensing agreement (Get in touch with me to discuss this)

CONTACT
Let's talk!

LEARNING
Learn to navigate change and transitions

TRAVEL
Join me on my next retreat